
Big Data: You Should Buy Bordeaux 2017 Now
Today our topic is practical, addressing what big data is in the real world.
Today our topic is practical, addressing what big data is in the real world.
Today our topic is practical, addressing what big data is in the real world. You could use the results immediately. At least … If you like wine.
Some of our readers may have read the book Super Crunchers by Ian Ayres, with the promising subtitle “How Anything Can be Predicted.” Sounds good, right? The book starts like this: “Orley Ashenfelter really loves wine: ‘When a good red wine ages,’ he says, ‘something quite magical happens.’ Yet Orley is not just obsessed with how wine tastes. He wants to know the forces behind great and not so great wines.” Orley is an economist at Princeton in his daily life. Since computers and Big Data (at least in some places) have become cool, people like Orley are called “Number Crunchers” by writers such as Ian Ayres. That certainly sells better than the explanation that Orley went to study statistics because accounting seemed to him a little too exciting at the end of high school. And I can understand that.
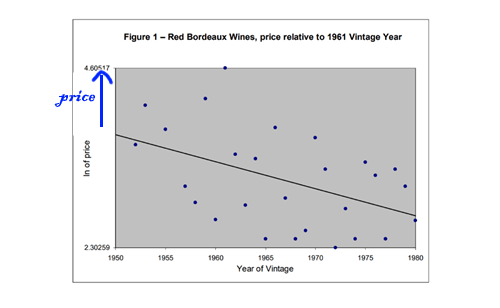
What’s nice about Orley, at least for people from our field, is that he started evaluating the quality of Bordeaux wines on the basis of statistics instead of spitting, slurping and teasing over tannins, soil types and wooden barrels. I will explain it. Below, we see the price of Bordeaux in 1983 (transformed, on the y-axis) set to harvest year.
There is clearly a declining trend, and that is because older wines become more expensive. But we also immediately see that the individual points are still very different from the trend line. This should, therefore, mean that the price of wine does not only depend on the age of the wine. But what’s that about?
Fortunately, Orley says the following: “It is quite simple: wine is a natural product whose quality is greatly influenced by the weather. If the summer is particularly warm, grapes ripen faster and then have a lower acidity. In the years that less rain falls, the grape becomes more concentrated, so it’s the hot, dry years that deliver exceptional quality.” Orley has reduced the quality (whereby the price represents the quality) in a regression analysis to the following formula:

In summary: the more rain in winter (there is a + in the equation), the higher the temperature in the summer (there is also a +), and less rain during the harvest (there is one -), the better the wine. Forget about the -12.415 at the beginning of the formula for now.There is still something to be said about the method by which this formula comes about. But today, we keep it practical. The only thing I want to explain is that the quality of the wine in this method is determined as (the logarithm of) the ratio of the price of each Bordeaux year to the price of the year 1961, which was an exceptional year.
This means that we can quantify the quality of a harvest by entering the number of millimeters of rain and the average temperature in that year, in the formula above. In fact, we could make a prediction of the price per bottle in a few years. We won’t be doing this right now, because it adds a whole lot of complexity that we don’t want at this moment. But what we can do now is to try and determine whether the harvest year 2017 is expected to be good or not so good. We could use different methods, but because a picture says more than a thousand words, we do it like this.
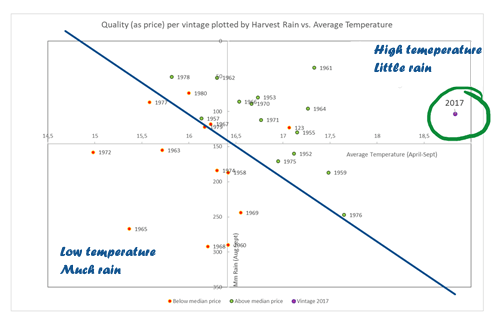
To the left, we plot the number of millimeters of rain during the harvest (August and September) per crop year against the average temperature between April and September. These two variables are the most important in the model. We disregard the rain in the winter for now. In green, we show all the harvest years that ultimately had an average price that was higher than the median of the years studied. In red we plot the cheaper ones. So, the most expensive 14 years are green, the cheapest 13 years are red. So, we see clearly that a higher temperature between April and September and less rainfall during the harvest yield the more expensive wines.
We can determine two clusters, a cluster with the more expensive years and a cluster with the less expensive years. And when we plot the rainfall and the temperature for 2017 in this same picture, we clearly see that 2017 is at the very end of the good years. And very far at that
That brings with it a whole new problem, namely that the temperature in 2017 was higher than all the observations that were used to estimate the model. And then it could be that the Orley model cannot predict this situation properly; was the summer of 2017 perhaps too hot? Unfortunately, we cannot say much about this based on the data that we have available. When interpreting this type of models, we must continue to think carefully for observations that fall outside the usual range. But for now, I am putting my money on 2017. Based on our model, chances are that it will be a great wine year.
Do you have questions or ideas? Or is something bubbling but you cannot put your finger on it yet? Get in touch, and let’s think together!

October 14, 2026
Software engineering stopped being about writing code. It became about managing context.
Read article
July 20, 2026
Every week I filter roughly 15 AI newsletters down to what matters for production teams.
Read article
July 13, 2026
This week had one theme: fracture. Three frontier labs shipped models in 72 hours.
Read article
July 7, 2026
Eighteen days without a frontier model is a long time when your production systems depend on it.
Read article
July 1, 2026
This was the week everyone stopped fighting over AI intelligence and started fighting over AI control.
Read article
June 22, 2026
This was the week the platforms stopped talking about AI and shipped infrastructure for it.
Read article
June 15, 2026
This week had one theme: the sovereignty fracture.
Read article