
Data Analysis in Business: 5 Tips for Getting Started
We all know that data is being generated at incredible rates, to the tune of 2 quintillion bytes every single day.
We all know that data is being generated at incredible rates, to the tune of 2 quintillion bytes every single day.

We all know that data is being generated at incredible rates, to the tune of 2 quintillion bytes every single day. That’s 18 zeroes, a figure pretty difficult to comprehend. And we all know that businesses can look to their data for smart decision making, using hard numbers and evidence rather than going on gut feelings.
However, we also know that data analysis in business isn’t always that easy. Despite having access to truly mind-boggling quantities of data – as well as multiple tools for understanding and interpreting it – Harvard Business Review reports that “leading corporations seem to be failing in their efforts to become data-driven.”
Among some of the surprising findings:
72% of executives report that they have yet to forge a data culture.
69% report that they have not created a data-driven organization.
53% state that they are not yet treating data as a business asset.
52% admit that they are not competing on data and analytics.
And keep in mind that these are huge companies like Ford, GE, and Johnson&Johnson. If they’re struggling to successfully manage and leverage their data, what does that mean for smaller companies, who may not have the same large teams, resources, and tools?
Not to worry. Even if you feel a little overwhelmed and unsure where to begin, you can definitely make careful, incremental, and inexpensive steps towards uncovering and understanding your company data.
Here are 5 essential tips to keep in mind as you consider rolling out a data analytics initiative.
With all the hype surrounding data in the past 15 years, you’d be forgiven for thinking you just need to select the right BI tool and watch the magic happen. However, just like any business initiative, it’s not quite that simple.
Start by setting clear goals about what you want the data project to achieve, and ensure everyone is on the same page. What specific business questions do you want to answer? For example, instead of asking, “How can data make us more money?” ask which products are most profitable, and whether there’s room to raise prices without losing sales. Ask which customers most often buy those products, and how you can get more customers like them. Ultimately, ask questions that help you understand the why, not only the what.
Many companies hesitate to implement analytics because they think it requires a team of data engineers, analysts, and scientists. Sure, you could go this route, but there’s no need to make it so complicated at the outset. There’s very likely someone already on your team who has the analytical skills and the desire to learn some basic data techniques.
For example, maybe you have dozens of people across departments using Excel for data entry and storage. With just a few advanced Excel skills, one of these team members could create an interactive dashboard that breaks down your sales by customer demographics, or shows a side-by-side comparison of all your salespeople. They could create models that show the results of adjusting your commission structure or supply chain. As you’re getting started, there’s a lot that can be discovered with just a few Excel tutorials.
That brings us right into tip #3:
There are hundreds of free programs online that will help your team learn more about the powerful data features of Excel. And there are free versions of most BI tools, such as Power BI, that you can experiment with before spending any money on training or upgrades. Leverage these resources to get some quick wins under your belt. This is an easy way to begin creating a data strategy before scaling up capabilities.
Reports tell you what’s happening in your business, and help you transform the data into an understandable format. Analytics involves exploring and interpreting data or reports in order to discover insights into why things happened the way they did. It provides a deeper understanding of your business, customers, and prospects.
Implementing both reporting and analytics creates a framework that answers your questions and optimizes your processes going forward.
What kind of data is your business collecting? Start your analytics initiative around what you already have, and grow it from there. Where is your data? In addition to spreadsheets, do you have data stored in legacy systems? Can disparate data be connected? You’ll want to get a handle on your data’s accessibility and limitations before determining your initial goals and questions.
How clean is your data? The quality of your answers is only as good as the quality of your data. Check whether data is duplicated, incomplete, or has errors.
Implementing an analytics program can seem like a daunting task. However, by starting slowly and building upon incremental wins, you can begin to discover significant insights — before spending a dime on more complex tools or initiatives. And if you need a little help in determining the exact right direction for your data plan, our Insight Snapshot service will tell you everything you need to know.
October 14, 2026
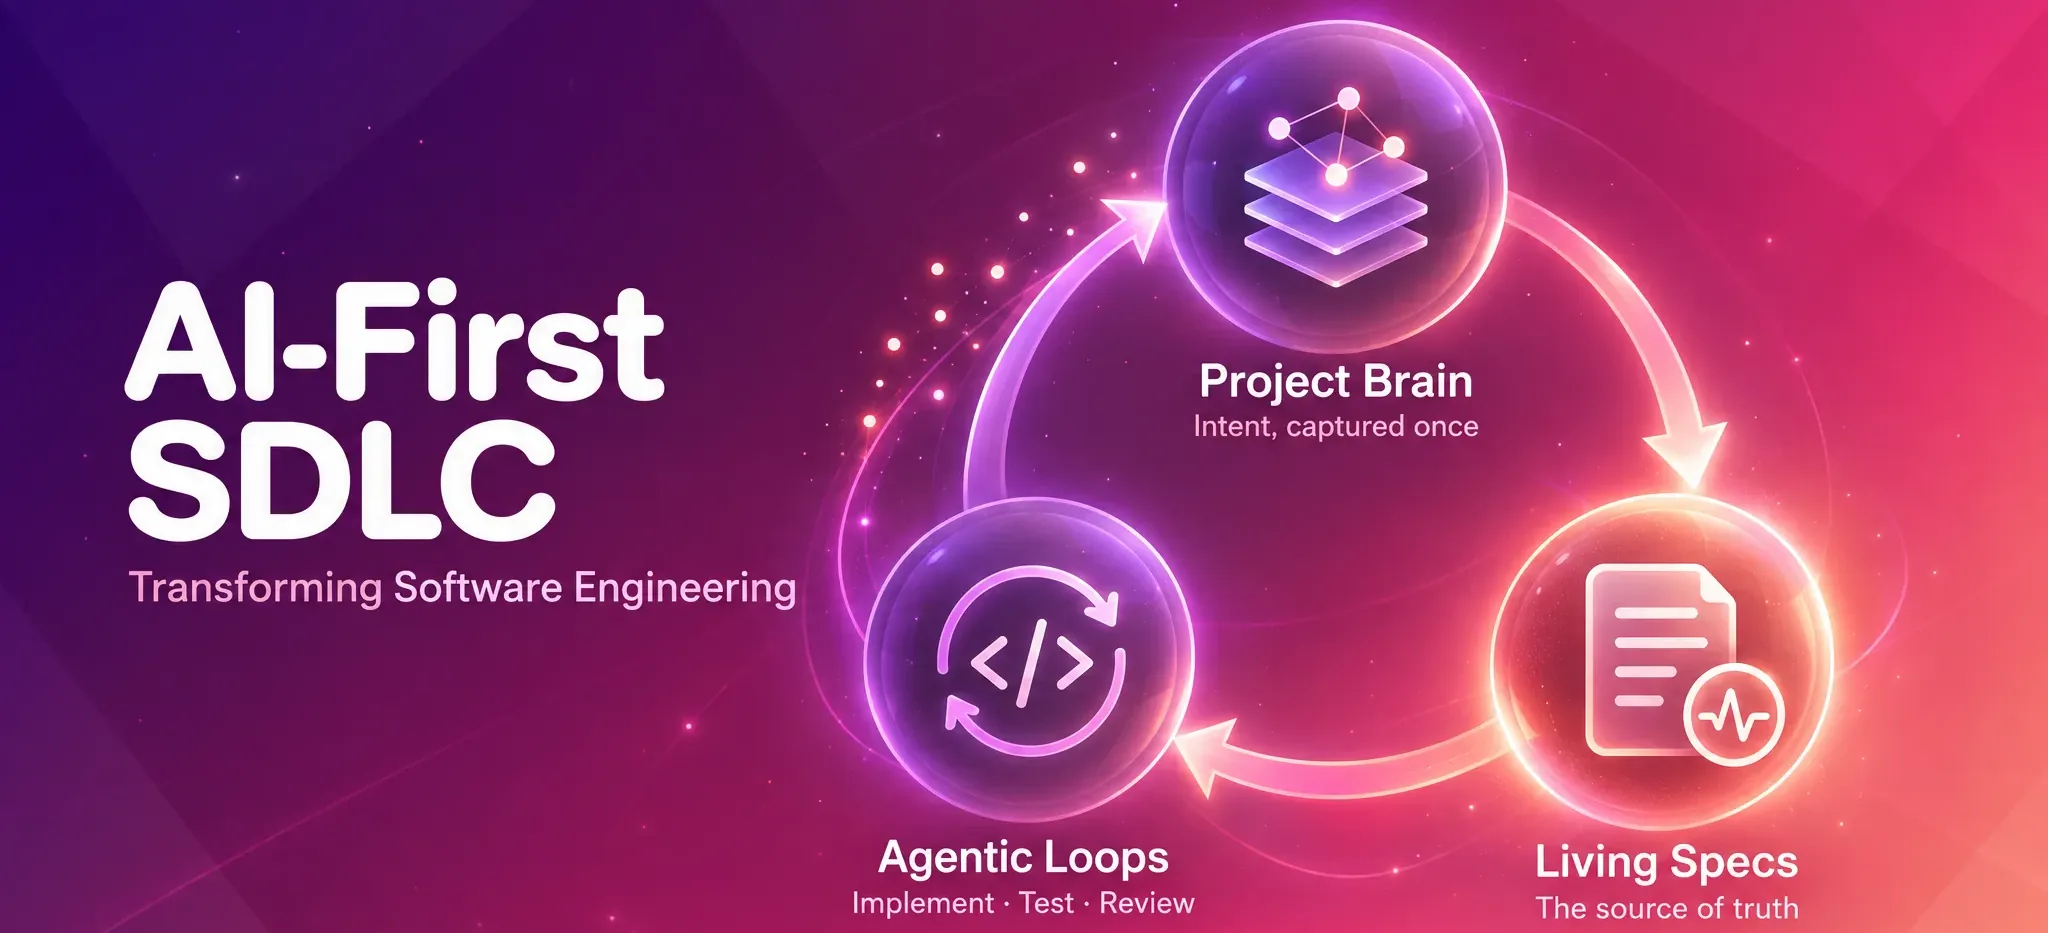
Software engineering stopped being about writing code. It became about managing context.
Read article
July 20, 2026
Every week I filter roughly 15 AI newsletters down to what matters for production teams.
Read article
July 13, 2026
This week had one theme: fracture. Three frontier labs shipped models in 72 hours.
Read article
July 7, 2026
Eighteen days without a frontier model is a long time when your production systems depend on it.
Read article
July 1, 2026
This was the week everyone stopped fighting over AI intelligence and started fighting over AI control.
Read article
June 22, 2026
This was the week the platforms stopped talking about AI and shipped infrastructure for it.
Read article
June 15, 2026
This week had one theme: the sovereignty fracture.
Read article